


Enhancing Austin’s climate goals through grant funding and regional collaboration
The City of Austin is proud to be a recipient of a $1 million grant from the Environmental Protection Agency (EPA), funded through the federal Inflation Reduction Act. This grant, part of the $5 billion allocated to the Climate Pollution Reduction Grants (CPRG) program, is designed to support states, local governments, tribes, and territories in developing and implementing robust plans to reduce greenhouse gas emissions and harmful air pollution. Our city plans to use these funds to collaborate with regional partners and neighboring cities, extending our climate planning and action beyond Austin’s borders.
Austin’s Office of Sustainability is leading this initiative for our region and has engaged a community and stakeholder advisory group to help along the way.
Creating a Priority Climate Action Plan
The first deliverable, a Priority Climate Action Plan, identified high-priority, ready-to-implement measures to lower emissions at a regional level. Staff focused on six priority greenhouse gas reduction measures. Each could be implemented quickly, benefit multiple communities and stakeholders, and have a clear implementation lead:
- Implement Transportation Demand Management programs
- Encourage and subsidize Renewable Diesel fuel (R99) availability
- Install community solar and battery storage
- Implement holistic building-wide upgrades to municipal buildings
- Implement water conservation programs
- Implement community-driven tree planting and forest restoration program
Read the full Priority Climate Action Plan (PDF, 5.2 MB).
Regional Greenhouse Gas Emissions Inventories (2022)
Five County Metropolitan Statistical Area (MSA)
24.3 million metric tons of CO2e10 metric tons of CO2e per personWith total greenhouse gas emissions of 24.3 million metric tons of CO2e and a population of 2,421,115, the per capita emissions in the five-county region were approximately 10 metric tons of CO2e per person (MT CO2e pp) in 2022. This is comparatively low in relation to the national average (21.7 MT CO2e pp) and other metro areas in Texas, including Houston-Galveston at 31.5 MT CO2e per person and Dallas-Fort Worth at 12.7 MT CO2e per person. The San Francisco Bay Area per capita emissions figures are similar to our region at 10.9 MT CO2e per person. |
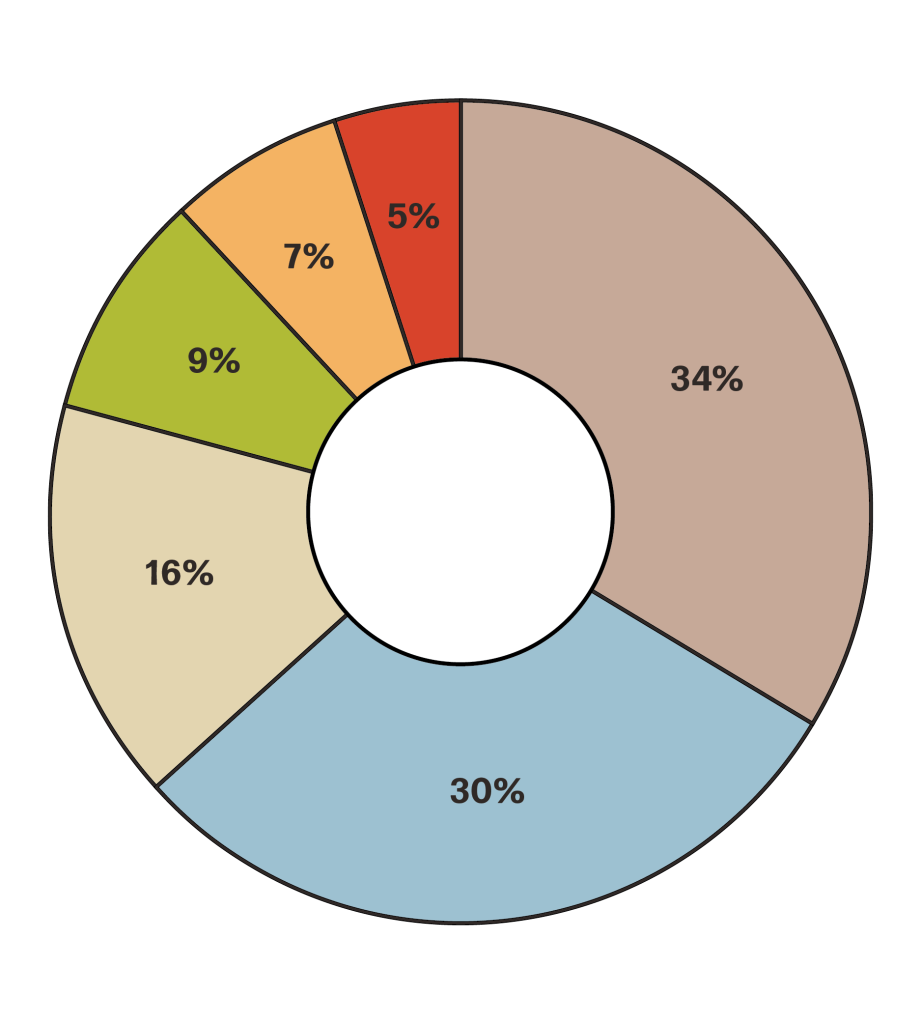
MSA emissions by sectorEnergy in Buildings emissions come from electricity (30%) and natural gas (16%) to combine for the largest source of GHG emissions in the region (46% total). Those emissions come from grid-supplied electricity and direct combustion of natural gas in buildings. Transportation contributes 34% of total regional GHG emissions, primarily from internal combustion engine vehicles using gasoline and diesel fuel on roads and highways. Industrial processes, like semiconductor manufacturing, cement production, and other similar activities, account for 9% of all emissions. Waste and water emissions (7%) come from solid waste in our regional landfills and wastewater treatment facility byproducts. Agriculture and lands create emissions (5%) in Central Texas through livestock, crop production — like corn and grain — and land use change. This sector presents an opportunity for GHG emission mitigation, as natural systems, like trees, can remove carbon from the atmosphere and yield other community co-benefits. |
  |
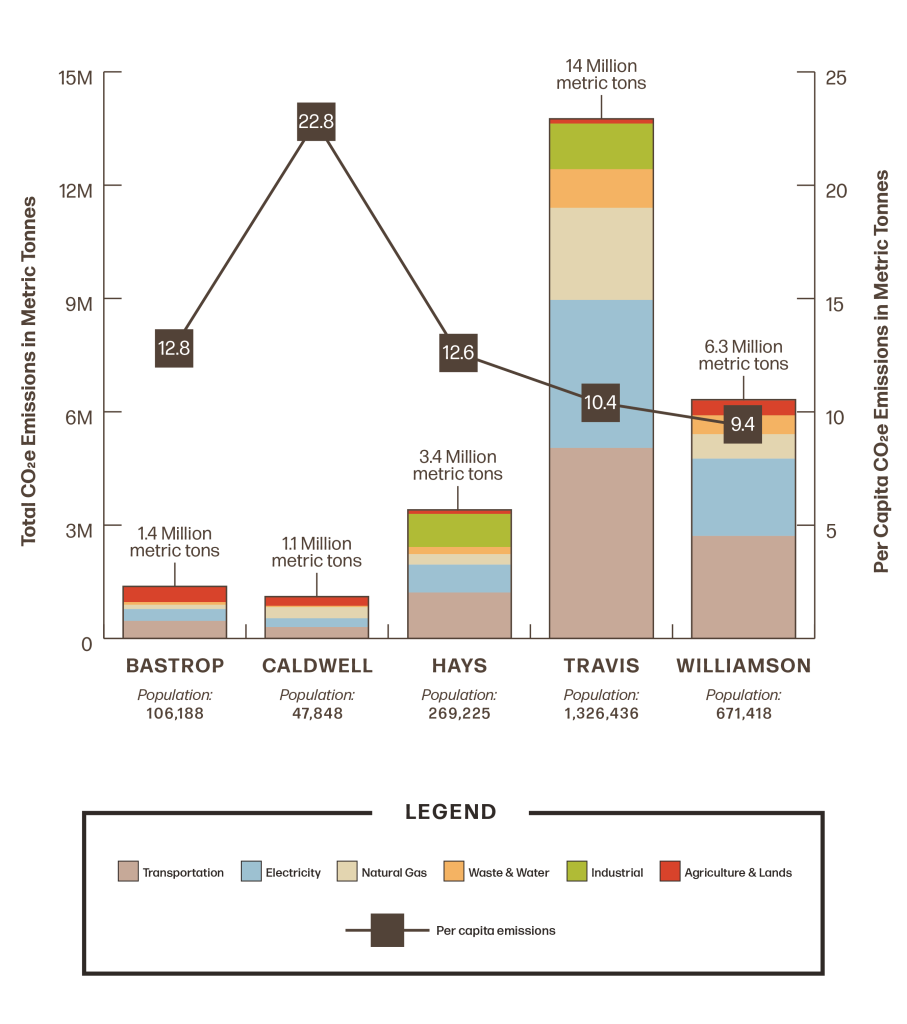
Bastrop County
1.4 million metric tons of CO2e12.8 metric tons of CO2e per personBastrop County has the second lowest total GHG emissions (1.4 million MT CO2e) and population (106,188), but the second highest per capita emissions in the region at 12.8 MT CO2e pp. A large portion of regional agricultural emissions (approximately one-third of the total) occur in this county. Bastrop has no large-scale industrial emission sources. |
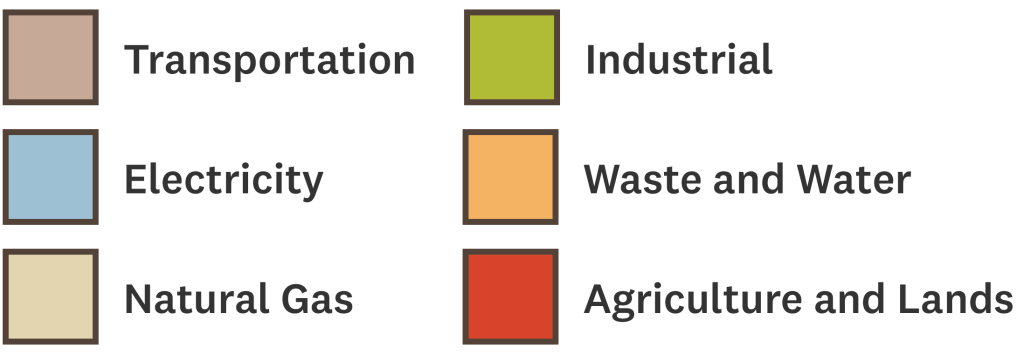
Bastrop County emissions by sectorEnergy in Buildings emissions come from electricity (23%) and natural gas (8%) to combine for the second largest source of GHG emissions in the county (31% total). Those emissions come from grid-supplied electricity and direct combustion of natural gas in buildings. Transportation related emissions (34%) represent the largest source of total county-level GHG emissions, primarily from internal combustion engine vehicles using gasoline and diesel fuel on roads and highways. Industrial processes account for no emissions in this estimate, due to no industrial facilities in the county reporting to the EPA. Waste and water emissions (6%) come from solid waste in our regional landfills and wastewater treatment facility byproducts. Agriculture and lands create emissions (29%) through livestock, crop production- like corn and grain- and land use change. This county has the largest share of agriculture and land specific emissions among all five counties in the MSA. |
 |
Caldwell County
1.1 million metric tons of CO2e22.8 metric tons of CO2e per personCaldwell has the lowest population (47,848) and total GHG emissions (1.1 million MT CO2e), but the highest per capita emissions (22.8 MT CO2e pp) in the region. This is largely due to emissions from agricultural activity (about one-fifth of the regional total) and relatively high natural gas consumption. |
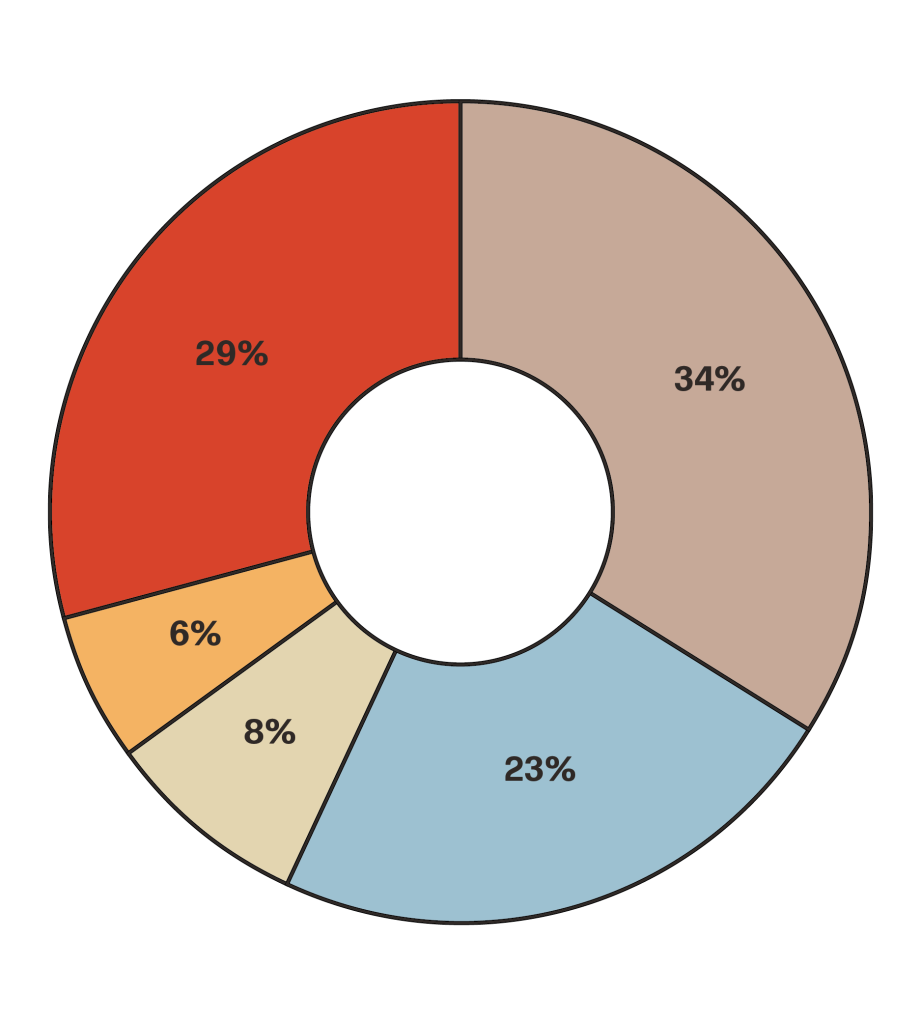
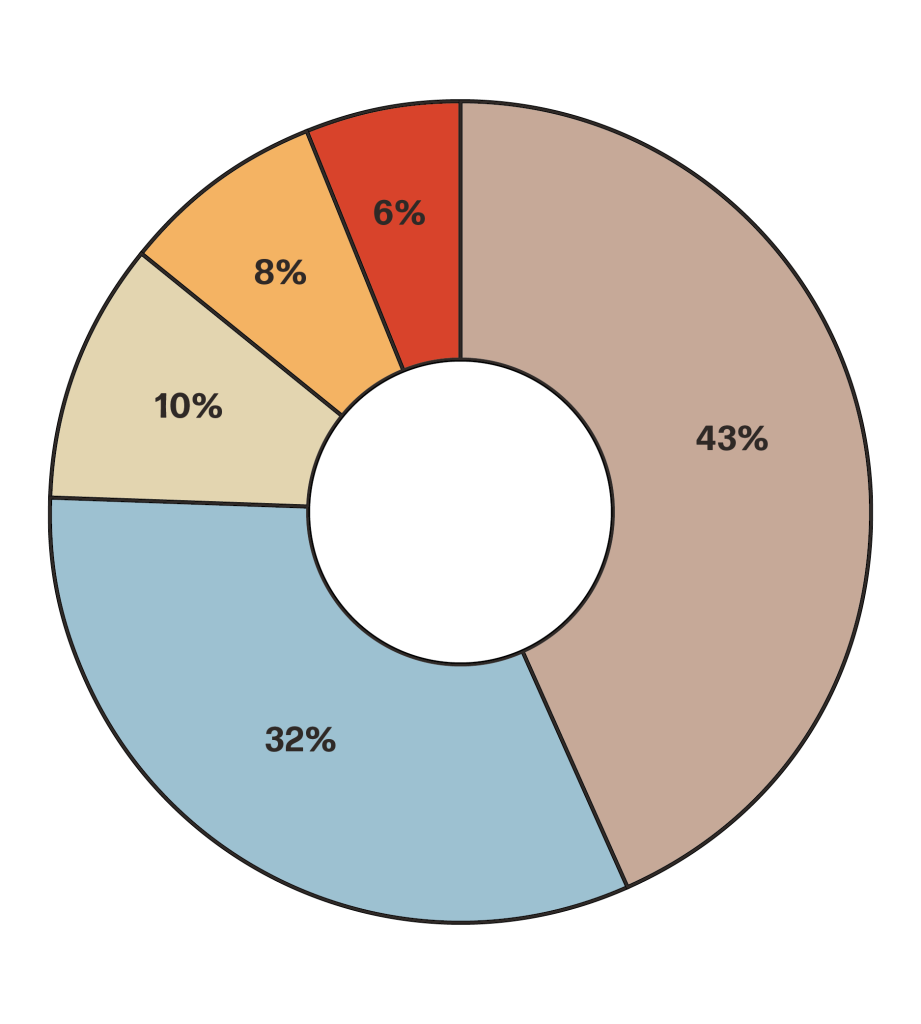
Caldwell County emissions by sectorEnergy in Buildings emissions come from electricity (21%) and natural gas (27%) to combine for the largest source of GHG emissions in the county (48% total). Those emissions come from grid-supplied electricity and direct combustion of natural gas in buildings. Transportation contributes 28% of the total county-level GHG emissions, primarily from internal combustion engine vehicles using gasoline and diesel fuel on roads and highways. Industrial processes account for no emissions in this estimate, due to no industrial facilities in the county reporting to the EPA. Waste and water emissions (3%) come from solid waste in our regional landfills and wastewater treatment facility byproducts. Agriculture and lands create emissions (21%) in Caldwell County . Despite having the smallest population, Caldwell has relatively high emissions from this sector, due to its elevated livestock head count, leading to the most per capita emissions in the five-county MSA. |
 |
Hays County
3.4 million metric tons of CO2e12.6 metric tons of CO2e per personHays County is ranked third in the region in terms of population (269,225), total emissions (3.4 million MT CO2e), and per capita emissions (12.6 MT CO2e pp). Hays County contributes approximately 42% of all industrial emissions in the 5-counties due to cement production activity. |
Hays County emissions by sectorEnergy in Buildings emissions come from electricity (22%) and natural gas (8%) to combine for the second largest source of GHG emissions in the county (30% total). Those emissions come from grid-supplied electricity and direct combustion of natural gas in buildings. Transportation related emissions (36%) represent the largest source of total county-level GHG emissions, primarily from internal combustion engine vehicles using gasoline and diesel fuel on roads and highways. Industrial processes, like cement production and other similar activities, account for 26% of all emissions. Waste and water emissions (6%) come from solid waste in our regional landfills and wastewater treatment facility byproducts. Agriculture and lands create emissions (3%) in Hays County through livestock, crop production- like corn and grain- and land use change. This sector represents an opportunity for GHG emission mitigation, as natural systems like trees, can remove carbon from the atmosphere and yield other community co-benefits. |
 |
Travis County
14 million metric tons of CO2e10 .4 metric tons of CO2e per personTravis County has the highest GHG emissions of any county in the region at 14 million MT CO2e – more than twice as much as the next largest contributor (Williamson County). However, its per capita emissions are second from the lowest (10.4 MT CO2e pp) despite hosting more than half the region’s population (1,326,436) and many large sources of industrial GHG emissions. This is largely due to the decarbonization and energy efficiency efforts of publicly-owned electric utility, Austin Energy. |
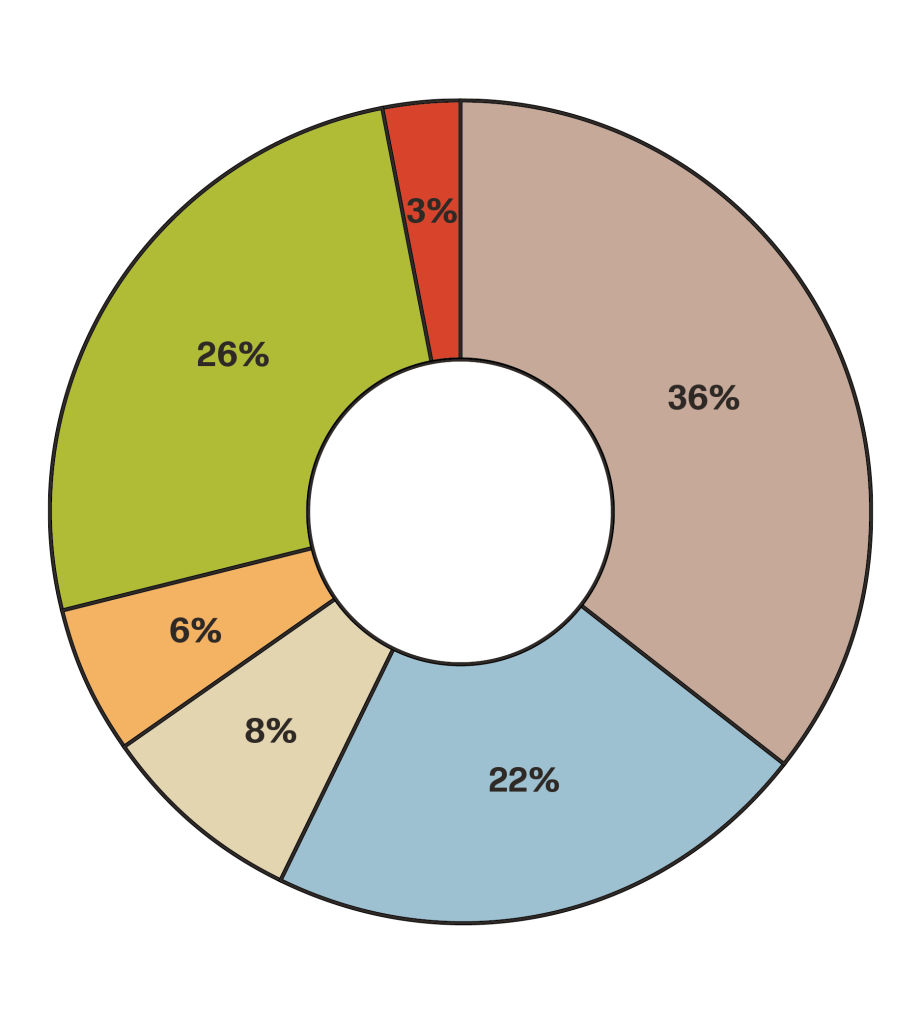
Travis County emissions by sectorEnergy in Buildings emissions come from electricity (29%) and natural gas (18%) to combine for the largest source of GHG emissions in the county (47% total). Those emissions come from grid-supplied electricity and direct combustion of natural gas in buildings. Transportation contributes 37% of the total county-level GHG emissions, primarily from internal combustion engine vehicles using gasoline and diesel fuel on roads and highways. Industrial processes, like semiconductor manufacturing, cement production, and other similar activities, account for 9% of all emissions. Waste and water emissions (7%) come from solid waste in our regional landfills and wastewater treatment facility byproducts. Agriculture and lands create emissions (1%) in Travis County through livestock, crop production- like corn and grain- and land use change. This sector represents an opportunity for GHG emission mitigation, as natural systems like trees, can remove carbon from the atmosphere and yield other community co-benefits. |
 |
Williamson County
6.3 million metric tons of CO2e9.4 metric tons of CO2e per personWilliamson is the second largest county in the region in terms of both population (671,418) and total GHG emissions (6.3 million MT CO2e). It has the lowest per capita emissions (9.4 MT CO2e), due to a relatively low natural gas consumption and no large industrial GHG emission sources. |
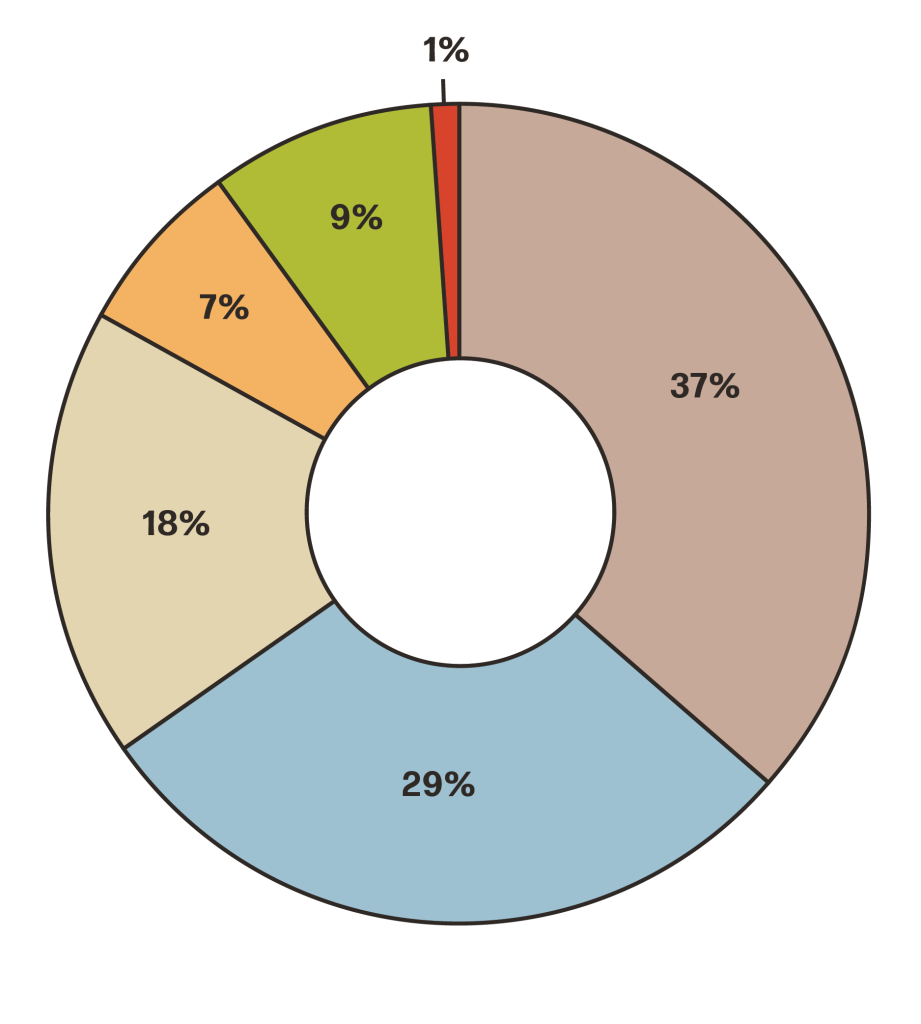
Williamson County emissions by sectorEnergy in Buildings emissions come from electricity (32%) and natural gas (10%) to combine for the second largest source of GHG emissions in the county (42% total). Those emissions come from grid-supplied electricity and direct combustion of natural gas in buildings. Transportation related emissions (43%) represent the largest source of total county-level GHG emissions, primarily from internal combustion engine vehicles using gasoline and diesel fuel on roads and highways. Industrial processes account for no emissions in this estimate, due to no industrial facilities in the county reporting to the EPA. Waste and water emissions (8%) come from solid waste in our regional landfills and wastewater treatment facility byproducts. Agriculture and lands create emissions (6%) in Williamson County through livestock, crop production - like corn and grain - and land use change. This sector represents an opportunity for GHG emission mitigation, as natural systems like trees, can remove carbon from the atmosphere and yield other community co-benefits. |
 |
- Explore comparative emissions data across all five counties.
CPRG Timeline
August 31, 2023 |
City of Austin notified of $1 million grant award |
|---|---|
September 21, 2023 |
City Council approved accepting of funds |
October 1, 2023 |
Project Kickoff |
November 20, 2023 |
New staff brought on board to help lead this work. Meet the team! |
March 1, 2024 |
Priority Climate Action Plan due. Read the plan. |
April 1, 2024 |
CPRG Implementation Grant applications due |
Mid-2025 |
Comprehensive Climate Action Plan due |
2027 |
Project Closeout |
Questions?
For information or to learn how to get more involved in the project, contact Rohan Lilauwala.